


Andoni Arraras from the integrated vocational training center to which he belongs actively works promoting innovation among the companies in his environment. In this interview we delve into their role within the TKgune network, the type of projects in which they usually work, and finally in the different opportunities that are presented to them thanks to the TKgune program.

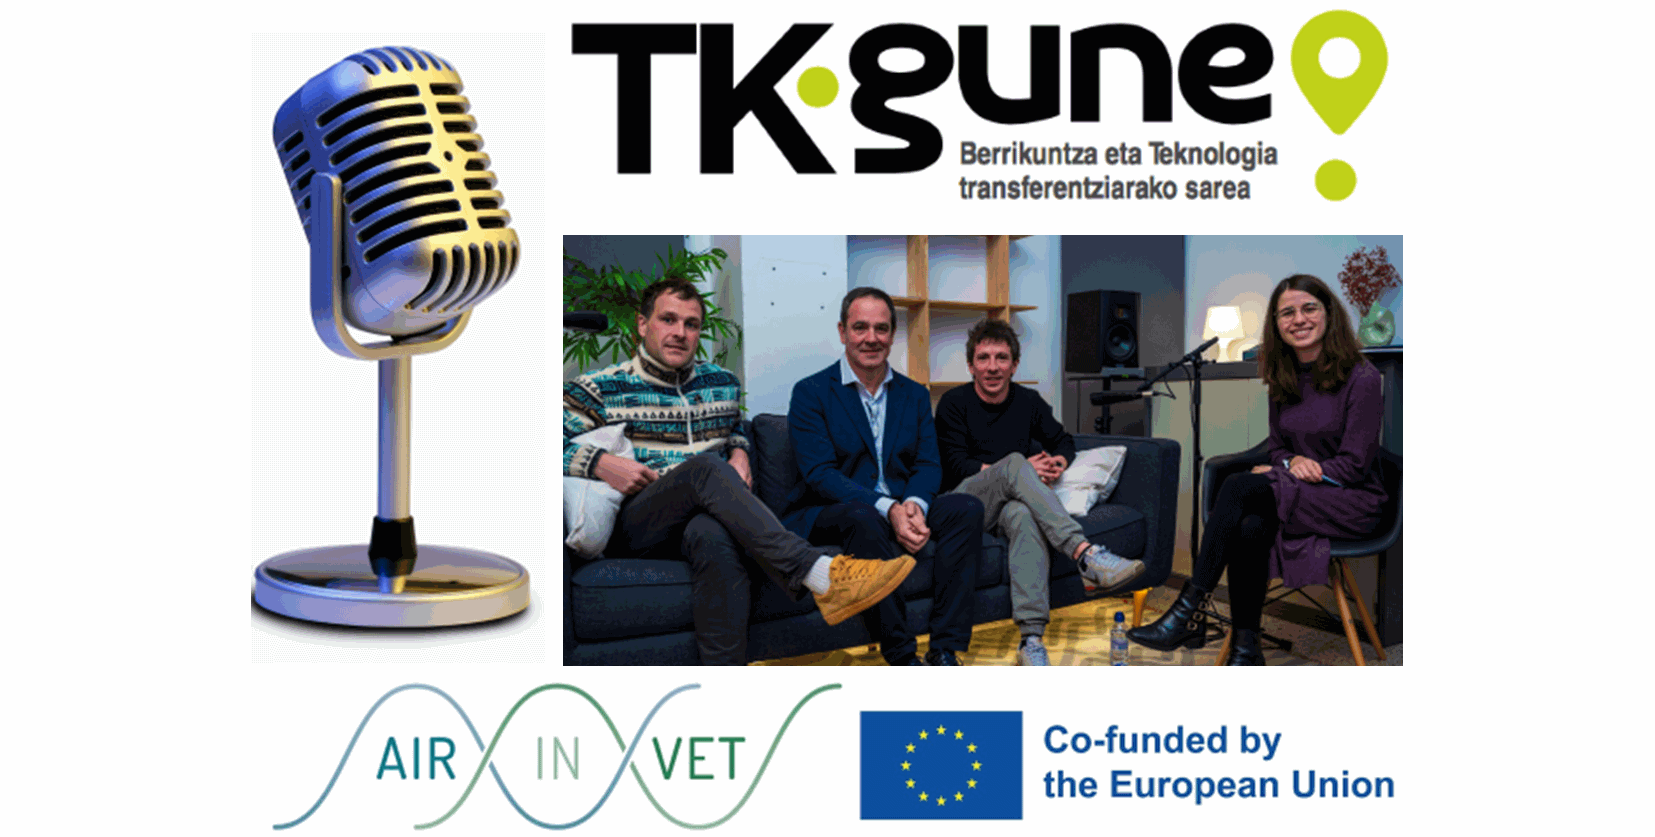
Today we interview Begoña Villanueva, who is a member of the TKgune team of Politeknika Ikastegia TXORIERRI, and thanks to the training received has developed a collaborative project in a company in the metallurgical sector.
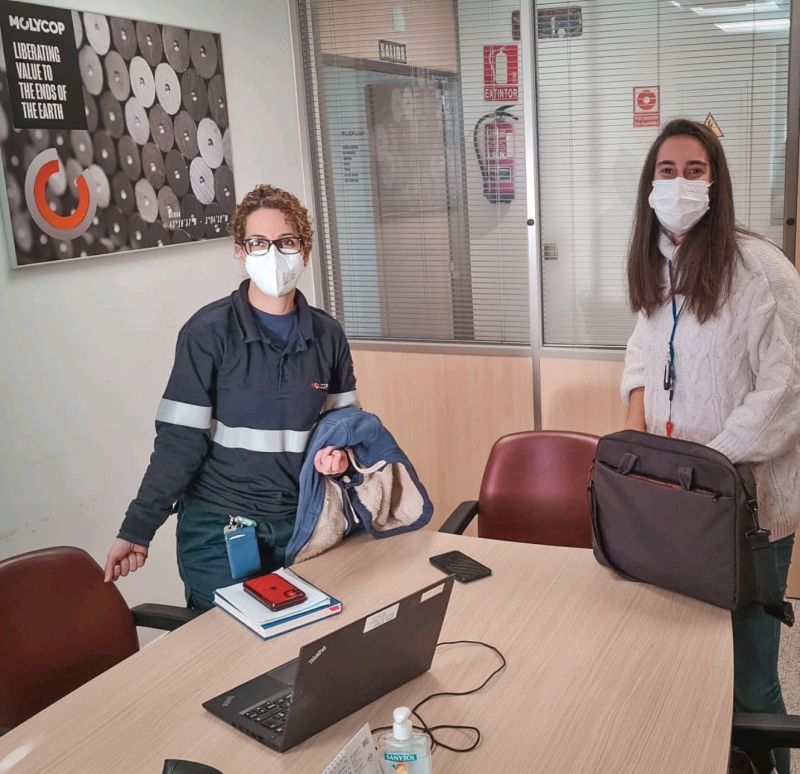
Begoña Villanueva (right) with the representative of the company MOLYCOP, in a working meeting where they have laid the foundations for the application of DATA ANALYTICS in the company.
Role of the coordinator
– What is your current job at the Tolosaldea Institute?
– I am the director of innovation of the center and also responsible for TKgune. From the school I take care of visiting the companies, offering collaboration with the TKgune and coordinating the development of the Tkgune projects that may arise.
– How many years have you been as Tkgune coordinator?
– 4 years.
– In your work team, do your colleagues repeat themselves year after year or is it a very changing group?
– Some have been 4-5 years and some have been 2 years. We try to make the team stable, and for now I would say that it is fulfilled.
– What was the reason for entering the dynamic of teaching at Tkgune/Innovation?
– I was a boilermaking teacher and we started developing projects related to this field. Afterwards, I went on to assist the coordinator in the management and, finally, when the coordinator became director of the center, I assumed the responsibility of coordinator.
Collaborative projects
– What kind of projects did you start doing?
– Technological projects in general, mechanical manufacturing, the world of mechanics, welding and boilermaking for the most part.
– At present and since the last 2 or 3 years, have you seen any evolution in relation to the types of projects?
– In our case we are still similar, but we have also developed those related to other fields; those related to cold-heat, those related to additive manufacturing, etc.
– Tell us how any of these projects came about, what you have done and how it ended.
– Yes, for example the case of a company that produces models for foundry:
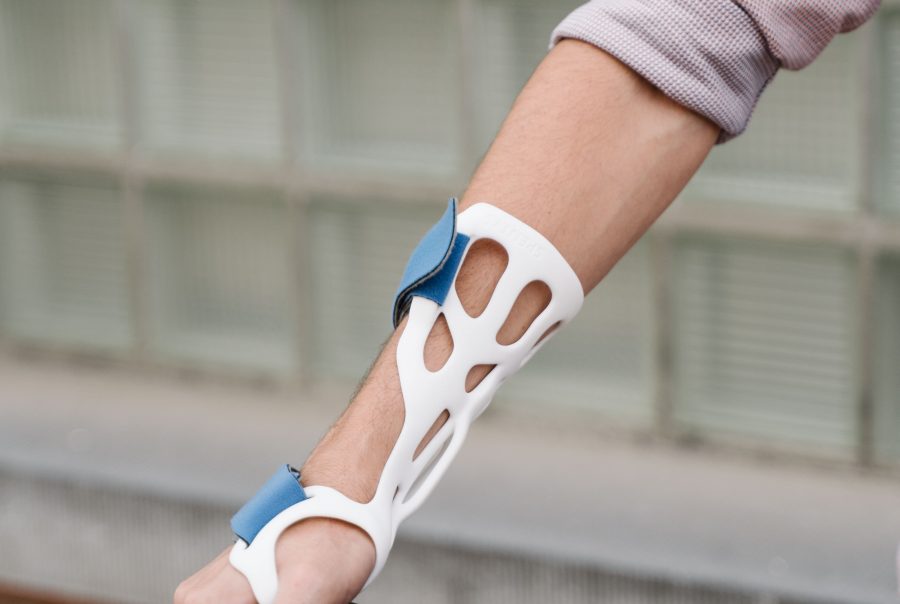
To respond to the requirements of their customers and the new regulations of the sector, they had to implement the methodology of measurement by 3D scanner. A professor from our center was working on a project of Tknika or the vice-ministry related to that topic. Therefore, as we had resources and taking advantage of the knowledge of the teacher, we made a series of measurements to the company, we taught them this new technology and we gave them training and the advantages and certifications they can have at work. As a result the company acquired this equipment and we launched it, we accompany them by monitoring throughout the process. Finally, the center has provided the rest of the teaching staff with the training of this new technology and other companies have been invited to know and use it in the future.
– What relationship is achieved with the company by carrying out this project? Is the collaboration maintained a posteriori?
– The relationship with the company is close and thanks to this initial collaboration, together with the Provincial Council of Gipuzkoa, we are developing a project with the company aimed at the development of people’s talent.
– As for the emotional point of view, the experience of the teachers who have participated in the project, what can you tell us?
– In general it has been positive and we have had very good feelings, although at certain times, being the expectations of the company a little high, there has been a feeling of fear due to ignorance and / or not achieving the objectives, although in the end everything has gone well.
– What other projects have you participated in?
– I can quote you the following:

In this delegation located in the industrial park of El Abra, in the municipality of Abanto-Zierbena, accidents occur at work and in order to register, evaluate and prevent them, the PRL department submits monthly reports to the parent company with all the data collected.
The advantage of implementing this type of solution is that the reports they have to submit are automatically generated from the information they enter daily through the forms that feed their databases.
Have you detected this type of need for the use and exploitation of data in the surrounding companies?–
We did not think about it before the training. Firstly because of our lack of knowledge of the existence of these programs and their possibilities, and secondly because we were not aware of this type of needs from the companies.
Now, however, it seems to us to be an innovative resource in such a way that once a study of the specific needs of each sector has been carried out, it facilitates the analysis of large amounts of data in order to make relevant decisions in companies.
Does the energy spent on training pay off in terms of what it can offer you…?
Of course. Any new knowledge that makes it possible to offer an improvement in the daily operation of the company is always worthwhile. The training received was a first introductory step into this world of data analysis, and I consider it necessary to continue learning and deepening in order to exploit its possibilities to the maximum.
Project development
The fields of the databases have been studied in detail together with the company, and a series of indicators that provide value for the company have been defined. With all this, a series of dashboards have been designed that show these indicators of the Occupational Risk Prevention area in a visual way, easy to understand and value.
EXAMPLES of Panels:
Dashboard 1: INJURIES
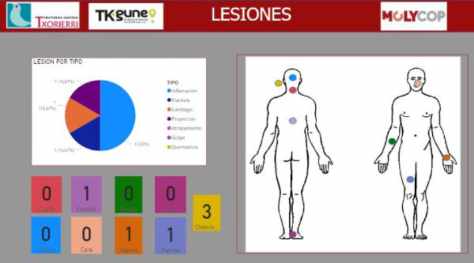
This first board shows the different injuries that occur throughout the month and are updated daily. They are categorized by type: burn, projection, inflammation, lumbago, entrapment, blow and fracture and by location: head, ear/eye, face, neck, back, arms, hands, feet and legs.
The purpose of this panel is twofold:
Firstly, to inform workers through screens located in the company of the current situation of accidents that have occurred, so it is a means of raising awareness in terms of adopting the appropriate safety measures.
On the other hand, at the end of the month, the total number of incidents is recorded and a detailed report is sent to the parent company.
Dashboard 2: ACCIDENT RATES
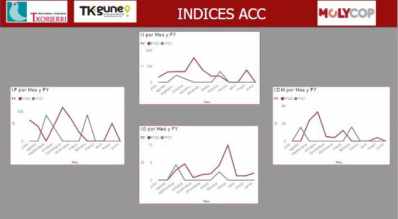
In order to systematically analyze the problem of occupational risks, the company manages a series of indicators or indexes related to occupational accidents, among which are the following:
-
-
Incidence
-
Frequencies
-
Average duration
-
Severity
-
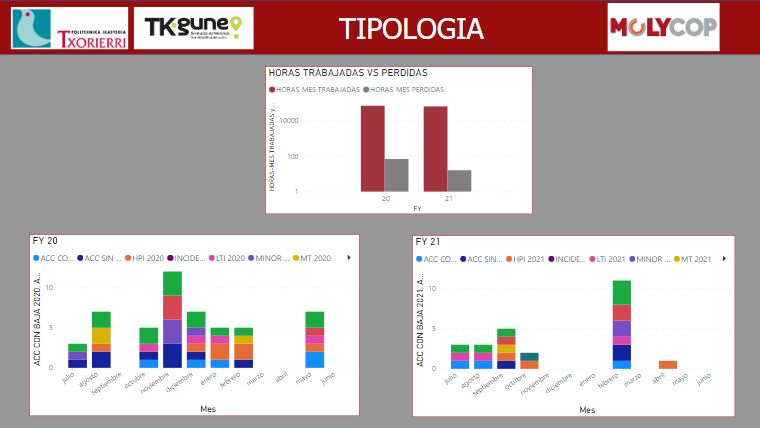
Thus, this dashboard shows several indices simultaneously, and compares them between 2020 and 2021 on a monthly scale by plotting them on the same graph.
Dashboard 3: COMBINED INDEX TRIF
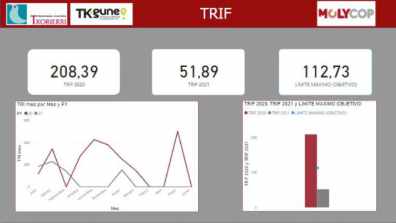
The last dashboard shown summarizes the value of the annual TRIF index achieved in 2020 and 2021.
This value combines several independent indicators into one by means of an appropriate weighting, and provides an overall reference of the company’s accident rate. These values are referenced to the company’s previously established maximum limit or annual target, which is shown on the right.
In the lower graphs, the left-hand side shows the monthly evolution and the right-hand side indicates the absolute annual values.
There is a noticeable improvement in its evolution between 2020 and 2021.
Other Dashboards used in the project:
